New in Reports: Aggregate metrics, coverage, campaigns, and user activity


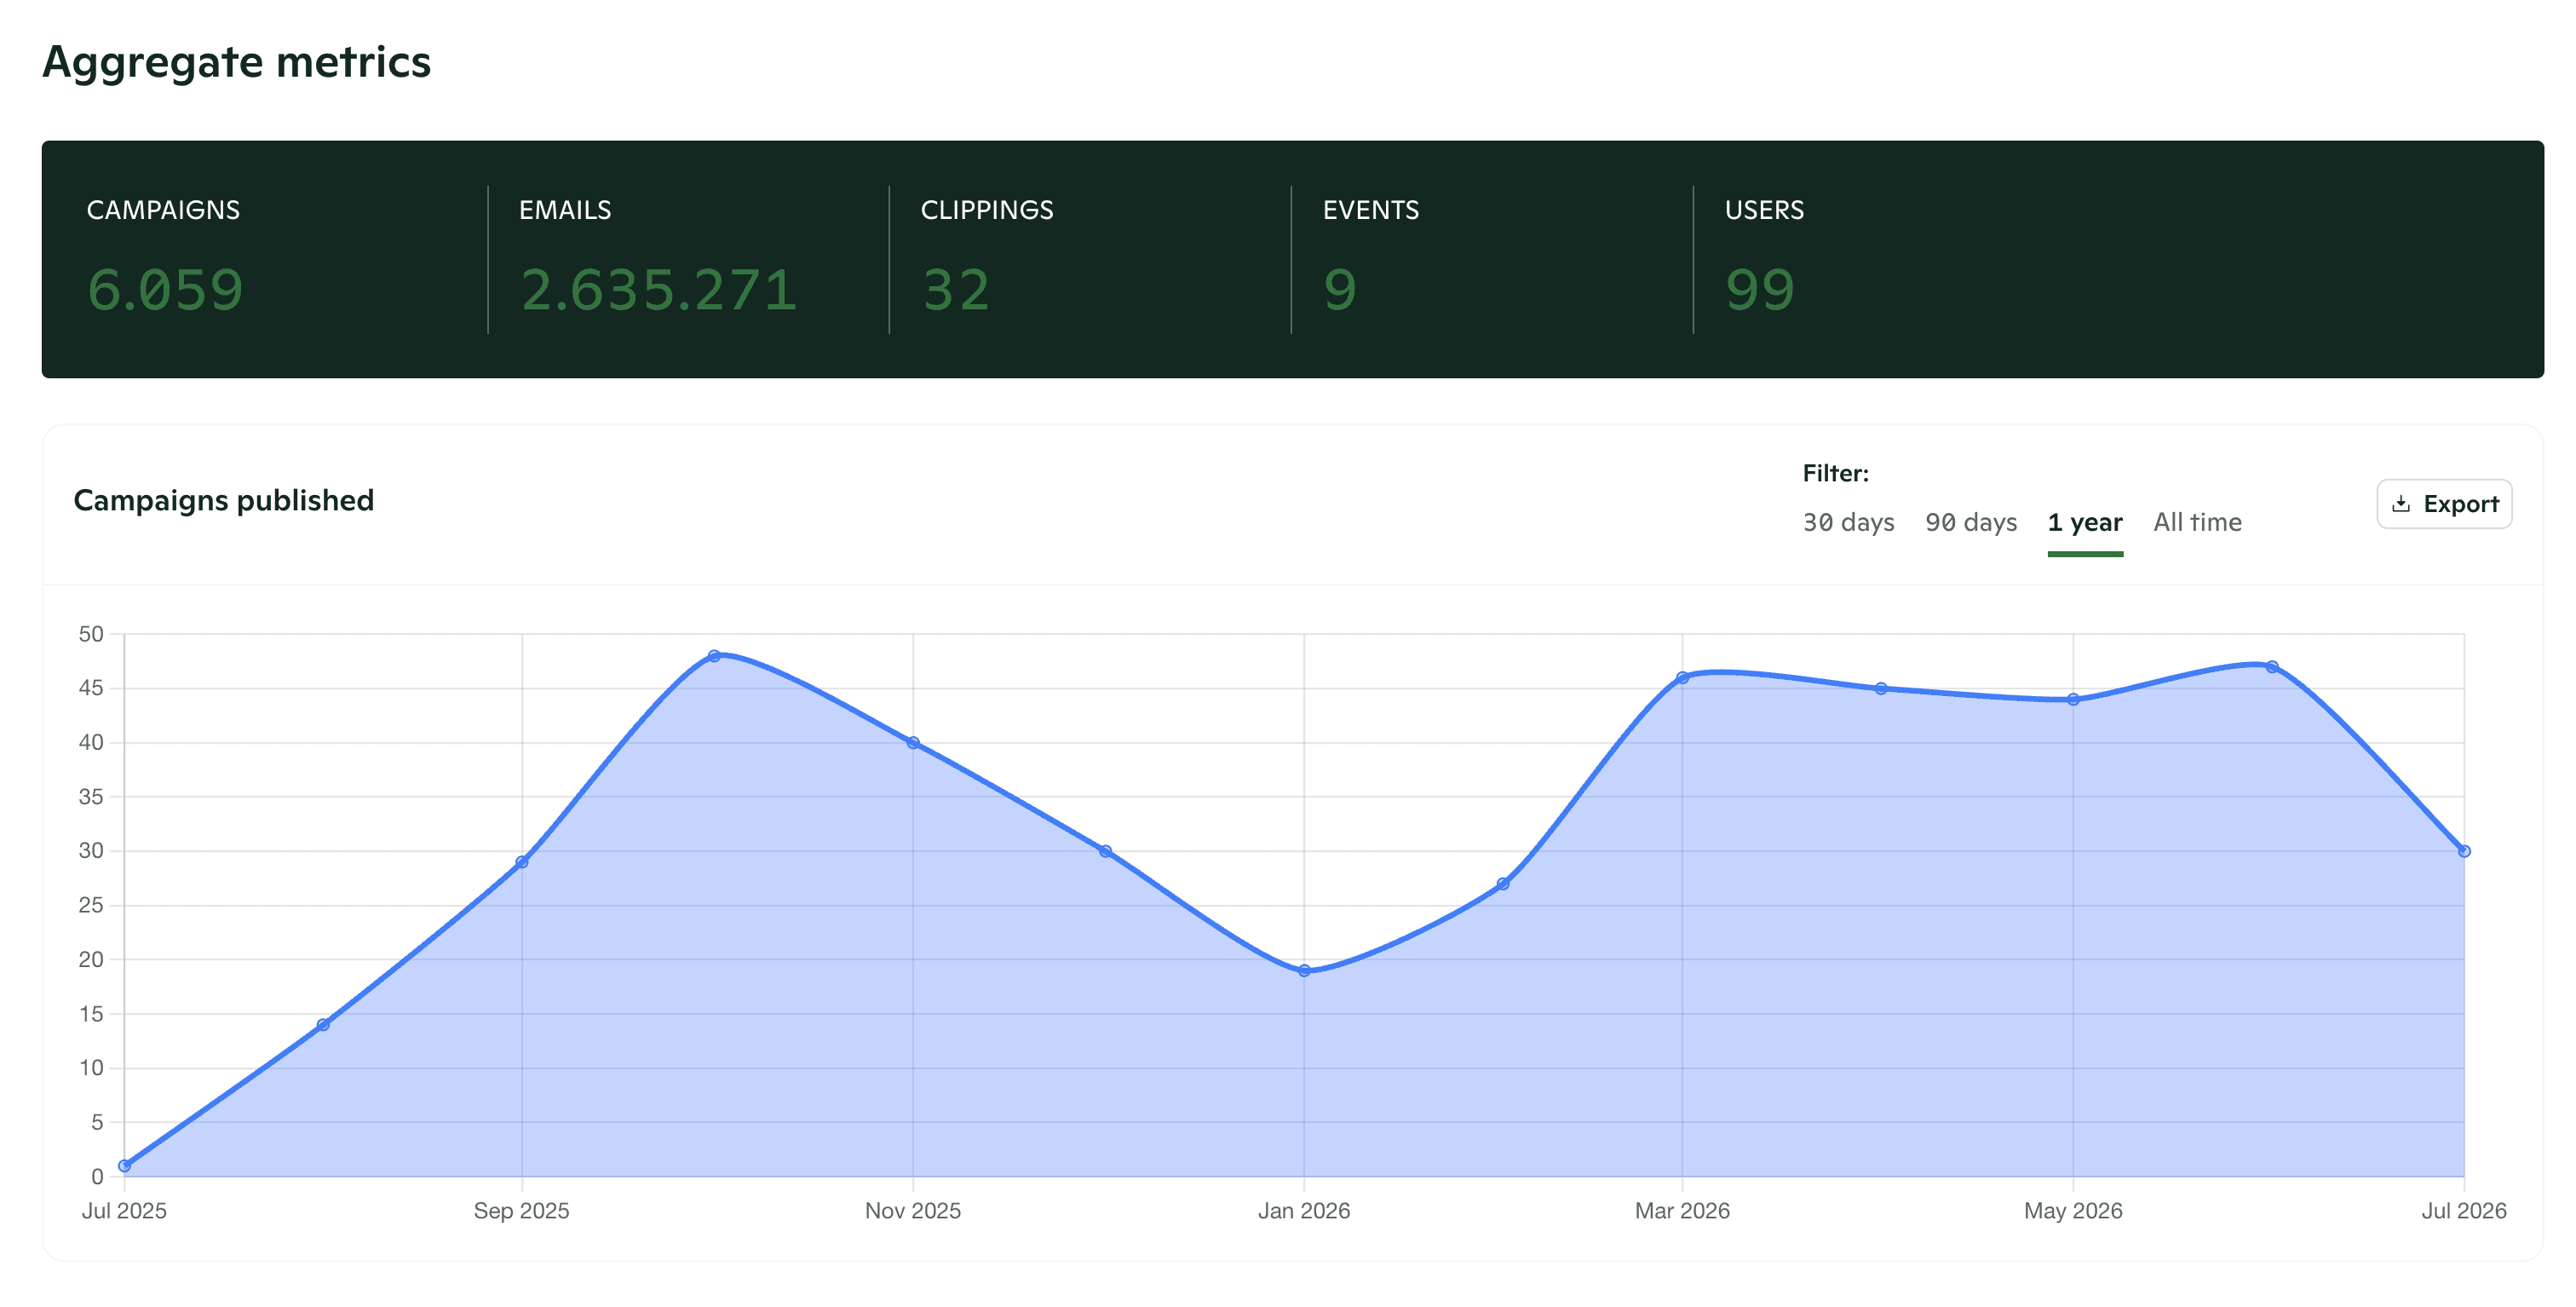
Turn your PR activity into reportable numbers. We’ve added four new pages to the Reports section: Aggregate metrics for platform usage, Coverage for all your clippings, Campaigns for performance tracking, and User activity for team usage.
Aggregate metrics
See your overall platform usage at a glance: total campaigns published, emails sent, clippings collected, events created, subscriber sign-ups, and leads generated. Filter by date range and view trends over time. Export any metric to include in presentations or reports.
Coverage
All your clippings in one view with the enrichment and sentiment analysis we added recently. Each clipping shows article metadata, readership numbers, domain authority, author contact details, and AI sentiment scores. Filter by date, source, sentiment, or language to find specific coverage. Export filtered results for coverage reports or presentations to stakeholders.
Campaigns
See all your campaigns in one place with their email delivery and clipping collection numbers. Each campaign shows publication date, category, spokesperson, team members, and performance metrics. Click through to view the full campaign report with detailed analytics. Filter by section or date range to identify which announcements generated the most coverage or track campaign performance over time, then export the data for your reports.
User activity
See who’s using the platform and how active each team member is. Track logins, campaigns created, emails sent, clippings added, and media kits created per user, plus their last login date and account creation date.
Published
Written by